


Unlocking higher ROAS on Meta: The complete guide
Grab your free copy of the guide to unlock higher ROAS for your D2C brand - covering creative recommendations, bidding strategies, and advanced audience selection.
Access the guide
How quickly can your company grow?
SaaS sales metrics can usually give you a good idea.
But first, you need to know which ones to track.
It’s sort of like learning how to make a new dish.
A sprinkle of LVR, a drop of MRR, a slice of CAC — these metrics (and more) each play a vital role in your recipe for success!

But only if sales leaders know how to use them correctly.
In this article, we’ll explain what SaaS sales metrics are and highlight the most important metrics to track.
Then, we’ll introduce you to an incredible tool to help you build a pipeline of product-qualified leads (PQLs) and increase your conversion rate.
Let’s get cooking! 🍳
Where marketing metrics show how well you draw leads in, sales metrics are data points that give insight into your SaaS sales performance.
A sales metric helps you understand three things:
Once you know what you’re doing right (and wrong), you can quickly address issues, shorten the sales cycle, strengthen customer retention, and learn how to differentiate yourself from rivals.
This, in turn, leads to growth and profit! 💰
So how do you go from kitchen nightmare to Masterchef?

Let’s look at every key SaaS metric to track your customer success:
1. Lead Velocity Rate (LVR)
The first item on our menu is LVR.
LVR tracks the month-to-month growth of qualified leads. In other words, you get to see if you’re actually increasing the number of leads you’ve determined to have a good chance of converting.
It’s important to track LVR to see how much sales growth you can expect in the future and if your sales cycle is functioning efficiently.
Your LVR formula is:

LVR = (This month's qualified leads - last month's qualified leads) / Last month's qualified leads * 100
For example, if you have 100 qualified leads this month and gained 80 qualified leads last month, your LVR calculation is:

LVR=[(100-80) / 80] * 100=25%
Your LVR will vary depending on your industry, product, and services. Mainly, you must compare it against other sales metrics within your company to see whether you should adjust your strategy.
For instance, if your sales growth doesn’t track with your lead growth, it could mean that marketing is qualifying the wrong leads or your sales pipeline is underperforming. Or, if your LVR is lower than what you’d need to meet your sales goals, you may need to focus more on lead acquisition.
Psst! If your pipeline seems a little undercooked, turn up the heat with a mind-blowing tool that can help you identify juicy qualified leads! 🔥
2. Activation Rate
LVR tracks the growth of your qualified leads.
Your activation rate shows you the percentage of users who performed qualifying actions.
Essentially, these are specific in-app interactions that help users realize product value, for example:
This data shows how effective your onboarding process is at guiding users to their “Aha moment”, where they realize your product is the apple of their eye.
Your activation rate formula is:

Activation rate= users who activate / users who sign up for trials * 100
Let’s assume 1,000 new users have started using your app. If 800 of them perform actions you consider ‘activation milestones,’ your activation rate calculation is:

Activation rate=800 / 1,000 * 100=80%
The average SaaS product activation rate is 36%, and the median is 30%.
Psst! Toplyne analyzes your leads’ product usage data so you can target specific segments of your target audience and skyrocket your conversion rate.
3. Monthly Active Users (MAU) to Daily Active Users (DAU) Ratio
MAU measures the number of users who engage with your SaaS product over a month.
DAU is similar, except it measures daily active unique users.
Here’s why these metrics are important:
Success means ensuring your customers and your product are inseparable, like…

Yep, your SaaS product needs to be sticky.
That’s to say, you need to serve a product that keeps users engaged and returning for MAU. 😉
But what exactly makes a user ‘active’?
Every company has different engagement criteria.
Some may determine DAUs by counting the users who log in on a daily basis. Others prioritize specific user actions, such as reaching a certain message threshold within the same timeframe.
Naturally, you want user engagement to be 100%.
That is, you want all your ratio of daily users to monthly active users to be 1:1.
However, that rarely happens as many users are only active on specific days/for a few days in the month.
In reality, B2B engagement benchmarks tend to be 13% and higher for B2C apps at around 35%.
4. Customer Acquisition Cost (CAC)
This key SaaS metric tracks the total cost of gaining new customers.
Amongst all sales and marketing metrics, CAC is one of the most important. It shows if you’re spending too much on your customer acquisition efforts.
So how do you CAC-ulate it?
It’s super simple:

CAC=sales and marketing costs / new customers
Let’s say that you gain 100 customers in a month. If you spend $12,000 in marketing and sales, your CAC calculation is:

CAC=12,000 / 100 =$120 per customer
The lower your CAC, the more attractive your company is to investors. You’re demonstrating that you can land a sale without spending too much to get them.
Fun fact: The average customer acquisition cost in the tech industry is around $200.
5. Customer Lifetime Value (CLTV)
Customer lifetime value measures the recurring revenue you can expect from certain customers over the entire SaaS business relationship.
The foresight CLTV can provide will help you optimize pricing plans, improve customer retention, and plan your sales rep budget.
Speaking of customer acquisition costs, CAC is like the eggs to your CLTV batter — you have to throw it in the mix!
Your customer lifetime value formula is:

Average CLTV = (Annual Recurring Revenue / Years of contract) - CAC
If your average customer signs a three-year contract and pays $100 each year, and your CAC is $120, your CLTV calculation is:

Average CLTV = ($100 * 3) - $120 = $180
With these figures, your CLTV to CAC ratio is 5:2.
In the SaaS industry, the benchmark for CLTV to CAC ratio is greater than 3:1.
6. Monthly Recurring Revenue (MRR)
Think of MRR as the pièce de résistance of the menu, the dish that makes stakeholders say…

Why?
Well, MRR is how much money you bring in every month. It provides a reliable picture of your future earnings and measures your company’s overall health.
With this sales metric, you can determine the success of the following:
Your MRR formula is:

Monthly recurring revenue=number of customers * monthly cost
Let’s say you have 1,000 customers on a $10 per month plan. Your MRR calculation is:

Monthly recurring revenue= 1,000 * $10= $10,000
But what’s the ideal growth rate?
According to industry experts, a net MRR growth rate of 10-20% is what you should be aiming for.
Fun fact: Annual recurring revenue (ARR) is how much money you bring in every year.
7. New Customer MRR
New customer MRR is the monthly earnings gained from a new sale, not an existing customer.
This sales metric gives stakeholders a quick overview of your success at acquiring new customers.
Your formula is:

New customer MRR= new customers this month / average revenue per user
If you have 100 new customers in a month, and each one brings in $100 MRR, then your calculation is:

New customer MRR=100 * $100= $10,000
This SaaS metric helps manage your CAC. If you’re not generating enough returns to justify your acquisition costs, it may be time to budget more efficiently.
8. Average Revenue Per User (ARPU)
ARPU is the average revenue you get from a single customer. Companies generally calculate it per month or year, depending on whether they offer monthly or annual contracts.
This metric is useful for tracking your growth trajectory, customer retention, and trends in your earnings.
Remember that ARPU doesn’t consider factors like most of your customers being on a lower-tiered plan.
For instance, if most of your customers are on a $10 per month plan, but you have a single enterprise contract at $10,000 per month, your ARPU will be skewed to look higher.
We recommend using this SaaS metric alongside other metrics and on a tier-by-tier basis. For example, you can use it to see how many months it’ll take to recover customer acquisition costs.
Your CAC recovery formula is:

CAC recovery=CAC / (gross margin / average revenue per account)
Suppose your average revenue per account is $100, and your gross margin is 60%. Your CAC recovery calculation is:

CAC recovery=$120 / (6 * 100) =2 months
9. Customer Churn Rate
Customer churn measures the percentage of customers that stop subscribing.

While it’s not the cheeriest SaaS metric, keeping an eye on customer churn is important. After all, your customers are the bread and butter of your SaaS company!
Your customer churn rate formula is:

Churn rate =(number of customers / lost number of customers at the month's start)* 100
Let’s say you have 20,000 customers in a given month. Then, 800 cancel their subscriptions. Your customer churn rate calculation is:

Churn rate=(800 / 20,000) * 100 =4%
To understand what your customer churn is costing you, calculate your revenue churn (the percentage of lost MRR)
Your revenue churn formula is:

Revenue churn =[(MRR at the month's start-MRR at the month's end) -MRR in upgrades /MRR at the month's start ] * 100
You must be wondering… what’s MRR in upgrades?
This is expansion revenue, the money you get from your existing customer base via cross-selling, upselling, or any excess purchases.
Let’s say your expansion revenue was $4,000. Your revenue churn calculation is:
![Revenue churn =[(MRR at the month's start-MRR at the month's end) -MRR in upgrades /MRR at the month's start ] * 100](https://cdn.prod.website-files.com/65a80db6a97ea2f4fd5302cd/65c090a3b064dd9e41262ae0_20240205T0737-f324ad4d-076b-45f3-9a9a-013d359c600f.png)
Revenue churn=[($200,000-$8,000)-$4,000 / $200,000] * 100=94%
Here are two important churn rate benchmarks:
10. Net Retention Rate (NRR)
Net retention rate is a metric that tracks the percentage of recurring revenue from your existing customer base.
To understand NRR, you need to know your MRR, revenue churn, and expansion revenue.
Once you have this data, you can focus on the most important metric: net revenue.
Your NRR needs to rise like…

So, how do you know if your net customer retention rate isn’t growing?
Your NRR formula is:
![NRR =[(MRR+expansion revenue)-lost income] / MRR * 100](https://cdn.prod.website-files.com/65a80db6a97ea2f4fd5302cd/65c090a3b064dd9e41262add_20240205T0737-1ee5c0be-ce4b-4609-90c7-3796d61f60ec.png)
NRR =[(MRR+expansion revenue)-lost income] / MRR * 100
Let’s say your monthly recurring revenue was $10,000. Then, you lost $5,000 in downgrades and churn. Your NRR calculation is:
![NRR=[($10,000+$4,000)-$5,000] / $10,000 * 100=90%](https://cdn.prod.website-files.com/65a80db6a97ea2f4fd5302cd/65c090a3b064dd9e41262af4_20240205T0737-2f247df7-5020-4d0b-9821-496cf3daa5c4.png)
NRR=[($10,000+$4,000)-$5,000] / $10,000 * 100=90%
For a SaaS company, you can tell your NRR is growing if it’s greater than 100%.
Now that you have the most important metrics locked down, your sales process should be a piece of cake. 🎂
But you may be wondering… are sales metrics the same as KPIs (key performance indicators)?
A sales KPI measures your progress toward defined objectives.
Metrics aren’t tied to certain goals. They measure overall sales productivity — however, they can become KPIs.
If this sounds a little confusing, let us clarify what we mean.
Suppose you aim to increase sales by 20% over the next three quarters.
That’s a sales KPI (key performance indicator).
You can then use metrics to see how well your sales process achieves that KPI.
Let’s look at three crucial SaaS sales KPIs your sales team should track:
Looking to boost your sales process?
We’ll introduce you to the chef’s choice!
Order up!
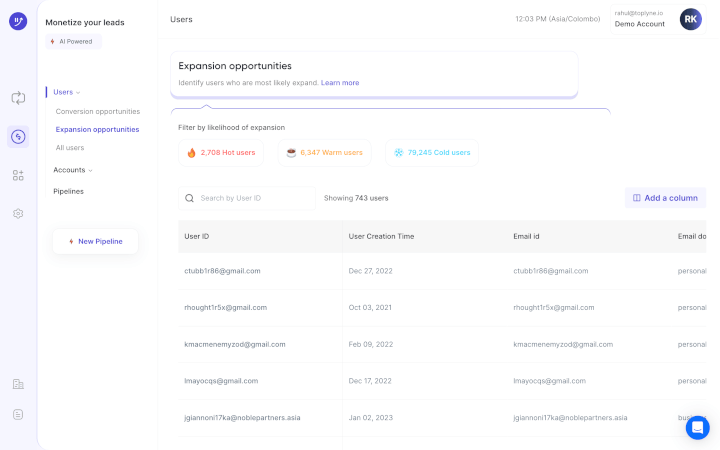
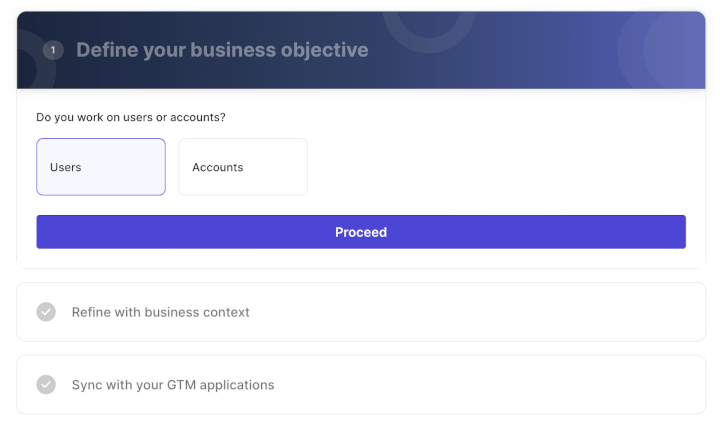
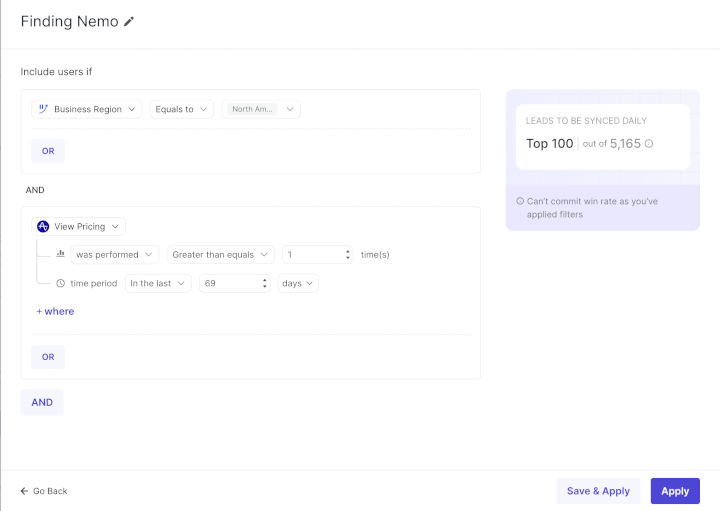
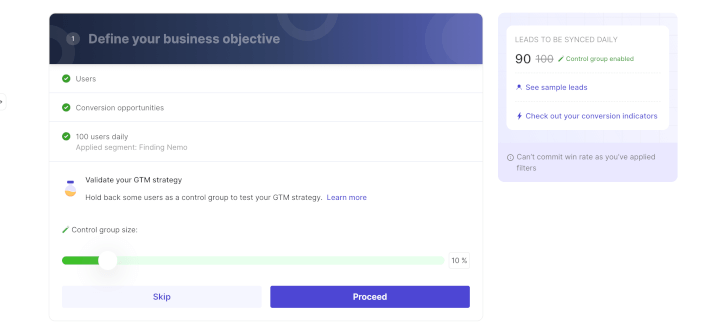
Toplyne is a unique headless AI tool that helps sales leaders create a smooth-as-butter pipeline of product-qualified leads.
Here’s why that’s important:
Having the best PQLs baked into your pipeline will undoubtedly boost win rates!
On top of that, this tool analyzes the behavioral patterns of each potential customer and identifies cross-selling and upselling opportunities. This means you can improve vital metrics like MRR and NRR!
Ready to get that dough? 🥖
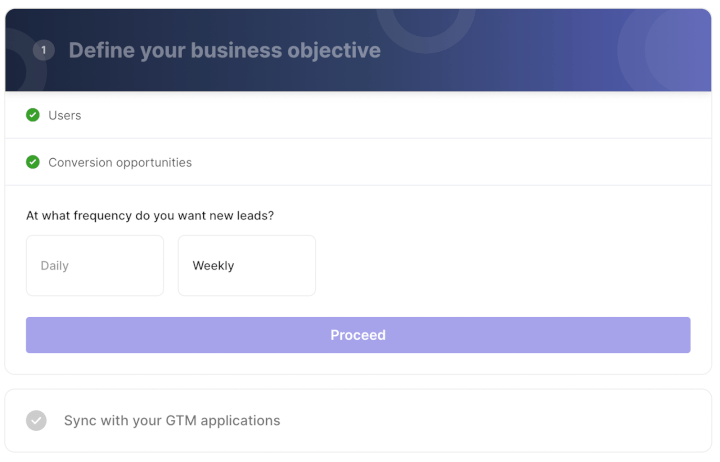
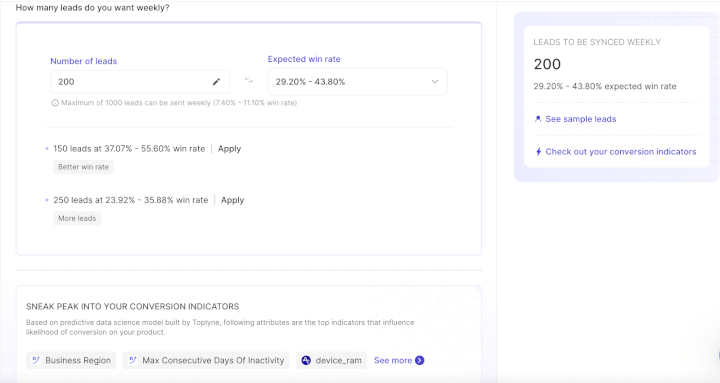
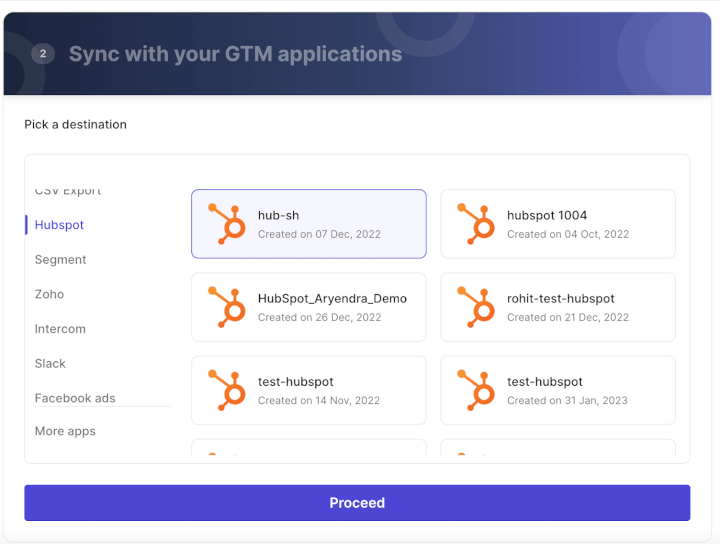
Let’s discuss how Toplyne supercharges your SaaS sales metrics:
If you’re starved from a lack of profits, you need a strategy to improve your sales efficiency. And using these 10 SaaS metrics is how you go from fast food to gourmet.
Still, catching any issues in your pipeline can be challenging, even with metrics.
How can you guarantee that your leads will offer enough value?
Luckily, Toplyne makes spotting high-intent leads easy as pie.
Use this one-of-a-kind tool to hone in on hot leads in your pipeline and watch your sales metrics surge!
Craving success?


.png)