


Unlocking higher ROAS on Meta: The complete guide
Grab your free copy of the guide to unlock higher ROAS for your D2C brand - covering creative recommendations, bidding strategies, and advanced audience selection.
Access the guide
Been in the SaaS world for a bit?
Well then, we’re pretty sure you’re trying out product-led growth (PLG) for your business. If not, it’s haunting you because your competitors are already reaping all the benefits of PLG! 👻

But here’s the thing:
You need to know which product led growth metrics to track for your specific SaaS company. This is irrespective of whether you’re already a PLG company or may become one soon. 🌝
Without them, you’ll be in the dark about all the progress you may or may not be making. #WhatANightmare.
So in this article, we’ll cover what product led growth metrics are and 10 fang-tastic PLG metrics you need to track. We’ll also highlight three key elements of a metric-fueled PLG strategy!
Ready, set?
Let’s ghoul! 👻
If a product-led growth strategy is your Halloween trick 🎃, you need to know if it’s scary successful enough.
How do you know if it is?
Enter: Product led growth metrics! *ta-da*
Each PLG metric is a qualitative and quantitative key productivity indicator (KPI) that monitors the effects and success of your PLG strategy — which will result in improved customer acquisition, customer success, product usage, and retention rates.
What are PLG metrics good for?
They:
Sounds like a treat? 🍬
Let’s check out the 10 product led growth metrics you can start tracking.
Knowing the most crucial PLG metrics for your SaaS company is as important as being scary is for Claire Dunphy.

As we reveal the metrics, we’ll also tell you how different areas of your product led company can leverage them. We’ll also make it easy for you by fitting each metric into a wider framework called the Product-led Growth Flywheel.
What is it?
It’s a framework for growing your business by investing in a product led user experience and fully realizing your product-led growth strategy.
The framework helps SaaS companies optimize user experience to move users from one stage of the user journey to the next (from evaluator to champion).
The framework also shows you what actions users need to take to advance to the next stage (from activating to advocating).

Now, let's get to it.
Activation is the moment a user realizes how your product solves their problem. Once activated, users are ready to invest time and money in your product!
Here are the PLG metrics associated with the activation stage of the flywheel:
1. Time to Value
Time to value (TTV) is the amount of time it takes a new user to reach their first “aha!” moment. It’s when a new user moves from activation to adoption in the product led growth flywheel.
For example, you open Amazon and look for last-minute Halloween costumes, and find a fantastic one within minutes — that’s your “aha!” moment.
Or, in this case, your “Arrr!” moment 😉.

But you want to reduce the TTV as much as possible. The sooner users go “aha!,” the better.
How?
Optimize your user onboarding experience around the key user actions (importing customer data or inviting colleagues to the platform) that correlate to activation.
Here’s how to check TTV:

Want to design an effective product led onboarding strategy?
Check out our guide on how to create a kick-ass product led onboarding experience!
2. Product Qualified Leads
Product qualified leads (PQLs) are users who have experienced your product’s value first-hand — either through a free trial or plan.
Pay attention, sales team!
The most boo-tiful leads are incoming!
But, how you define a product qualified lead depends on the users’ specific actions within your product, indicating they’re ready to move on to the next stage.🚶🏻♀️
For example, the user:
Ensure you bag more PQLs because they’re close to converting!
3. Feature Adoption Rate
You’ve probably already considered the product adoption rate, especially if you have a product management team.
But have you considered the feature adoption rate?
If not, get to it…

You can’t use one and ghost 👻 the other.
Consider both metrics as they indicate how well your target users received your product.
What’s the difference between the two?
The product adoption rate reveals the percentage of active users, while the feature adoption rate reveals why people continue to engage with your product.
You will see that the new feature adoption rate is driving your overall product adoption rate.
Additionally, insight into which features users find the most valuable will help you better position your product and make informed product decisions.
Here’s how to calculate the monthly feature adoption rate:

4. Customer Acquisition Cost
Customer acquisition cost (CAC) is the costs (sales, marketing, etc.) associated with getting a new customer.
To calculate customer acquisition cost:

Customer acquisition cost is typically very low for companies following the product led approach.
Why?
Well, new customers can self-serve. They experience the product’s value themselves through free trials or freemium plans instead of demos and sales reps.
Users who adore your product, enjoy using it. They’ll show it by trying out new features, discovering new use cases, and providing customer experience feedback.
Here are the metrics related to the adore stage:
5. Expansion Revenue
Expansion revenue measures the revenue generated from existing customers through cross-sells, upsells, add-ons, etc.
Just like candy is to Halloween, expansion revenue is to SaaS growth. #crucial
Why?
Think about it:
Acquiring more money from happy customers is way easier than signing on brand-new accounts.
Here’s how to calculate expansion revenue:

6. Customer Lifetime Value
Customer lifetime value (CLV) is the prediction 🔮 of how much revenue your business will gain from a single customer during the entire relationship.
This lets you easily:
Here’s how to calculate this metric:

Note: The cost of user acquisition should be lower than the lifetime value of a given customer segment. This logic can also help sales determine which customers they should spend their energy pursuing.
7. Net Revenue Retention
Your net revenue retention rate shows how much revenue you’ve generated after considering your expansion revenue and your churn rate.
What does this mean for you?
Knowing how much money you’re generating from retained customers shows you how effective your upsell and cross-sells marketing efforts are. This also means you can uncover any weaknesses in your product that are pushing users to downgrade their plans. 💔
Here’s how to calculate this metric:

Users who have adopted your product use it without thinking about it. 💭 At this point, your product is key for their organizational workflow.
Here are the metrics associated with adoption:
8. Average Revenue Per User
The average revenue per user (ARPU) is the average amount of money that you can expect to earn from an individual user.
How do you calculate this metric?

Average revenue per user tells you if you’re attracting high-value customers who are invested in your product. It also showcases how successful your upselling and cross-selling strategies are.
9. Free Trial Conversion Rate
Free trial conversion rate measures the number of free users who converted into paid customers during a free trial period.
Here’s how to calculate:

The free trial user conversion rate for product led companies should be high.
Why?
A free trial user can quickly obtain value from the product and understand how they can use it to succeed. And that’s why it’s important for product led companies to design products with fantastic user experience.
Learn more on How To Boost Free Trial Conversion Rates.
In this stage, your users love your product and want to see it succeed. Can we get an awwww…. 🥰
Here are a few customer satisfaction metrics you should track to spot your product’s advocates:
10. User Feedback Metrics
Do your customers consider your product to be a real head-turner?

You can find that out and more by gathering customer feedback. Here are a few metrics that can help you do this:
But hey, you don’t keep only three kinds of candies on Halloween, do you? 🍭
So you shouldn’t rely on just three survey metrics.
As a product manager, you can also collect qualitative customer feedback using open-ended questions, like:
Now that you know all the metrics to track for the success of your PLG company, let’s go over the three key elements of a product led approach.
Here are the 3 pillars of a metric-fueled product led company:
Sometimes last-minute Halloween costumes don’t work out.
Last-minute metrics are no different!
Considering metrics late, right before a product or feature launch, can leave you in a very scary situation. You’ll suddenly realize you have no way to measure the success of the launch (hello, product team nightmare 👋).
What’s the fix?
Don’t push the task of deciding metrics to the very end. Instead, set the right metrics and track them from the get-go. 💪
So you’re tracking the right metrics. Awesome!
But what was your user’s journey like?
Was it a satisfactory and pleasant experience?
Or did they find it to be a horror show? 🗡️🩸
Not many of the PLG metrics we discussed tell your users’ stories — which is a major issue for a product led growth company. So you need to pay extra attention to customer experience and clear out any obstacles from your potential customers’ quest for value.
This way, you not only create a satisfactory user journey for your customers, but you can also get an idea of the expected customer journey so you know the path your users will take.
It’ll also ensure you’re not missing any chance to interact with your customers at any stage.
Once you’ve mapped out the user journey…
Next, you’ll have to track your metrics against your goals using the right technology.
Grab yourself a drink 🍷 because we have just the tool to make the life of your product led growth company simple.
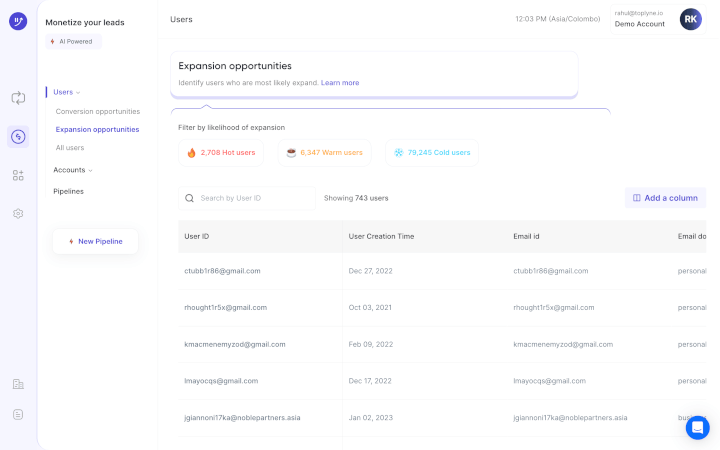
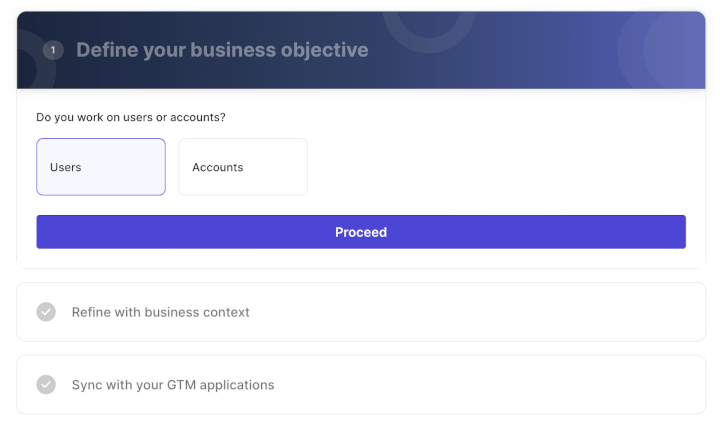
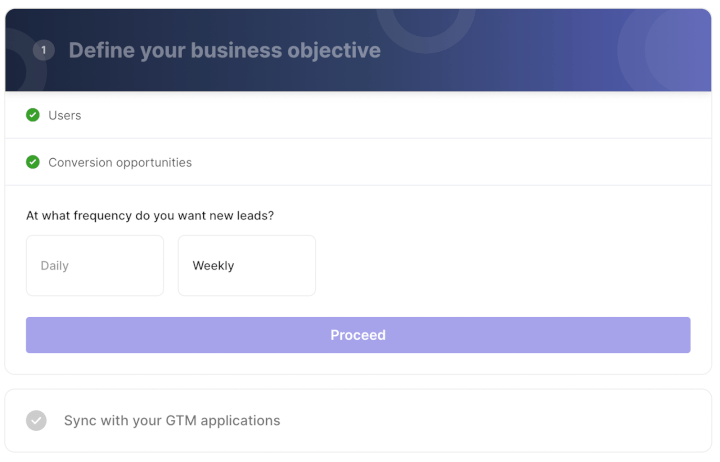
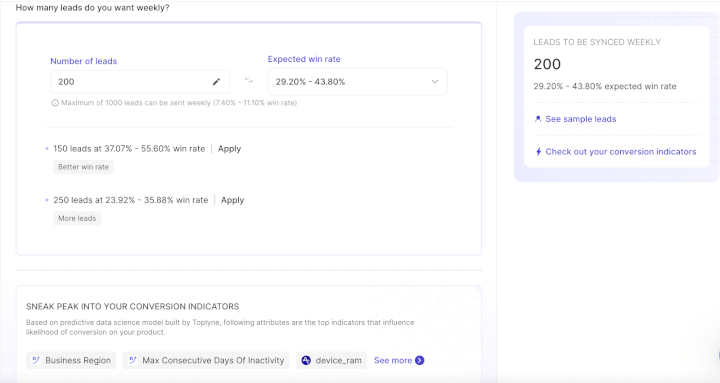
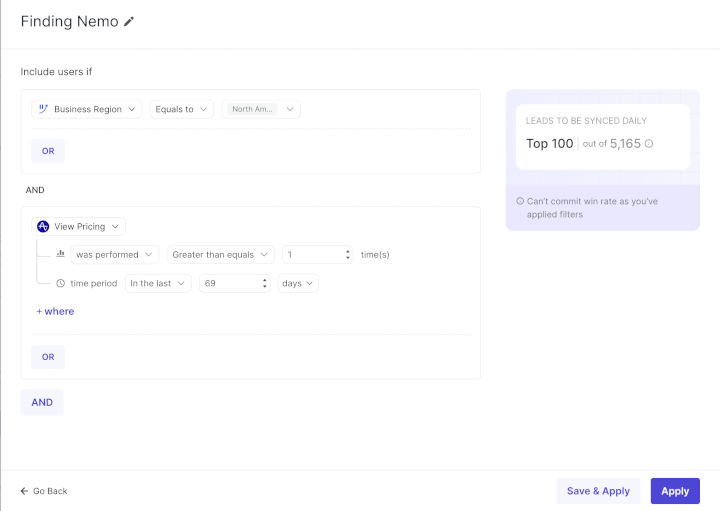
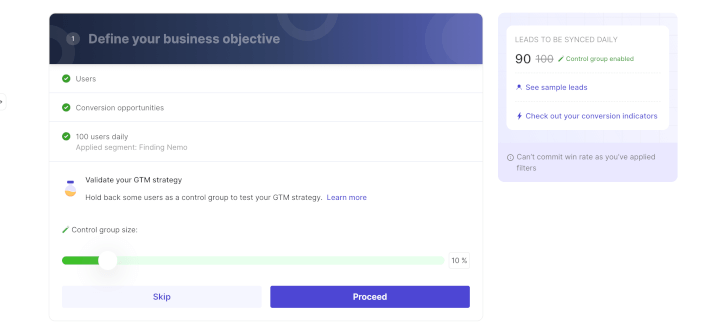
Meet Toplyne, a go-to-market (GTM) orchestration platform!
The tool lets product and growth teams connect the dots from user signals (behavioral, demographic, billing, and more) behind the metrics to business outcomes (new sales, upsell opportunities, reduced churn).
What does this mean for you?
You’ll have the superpower to optimize your product experience.
The best part?
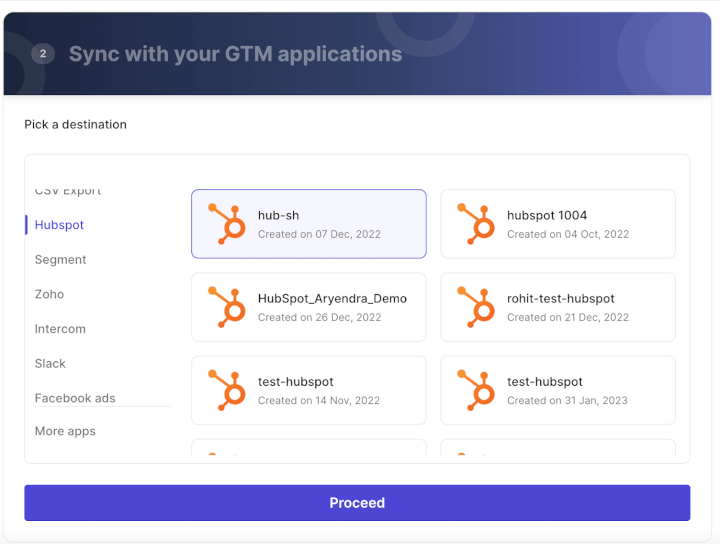
The tool combines product usage data from your product analytics tools (Amplitude, Mixpanel, etc.) with your existing GTM apps to create different customer segments.
Here’s how companies like Canva and Vercel generate sales pipeline from their self-serve funnel using Toplyne:
Treat all the way!
Tracking these PLG metrics will only make you more aware of everything you can do right to convert more users. As well as, avoid jump scares from poor business performance and product experience!
And with a tool like Toplyne by your side, you can taste sweet success in no time. All thanks to its ability to target specific persons, find high-intent users, and more!
Sign up with Toplyne for free today to master your product led growth metrics and spook your competitors with your success! 😎


.png)