What is product usage?
What is product usage?
What is product usage?
Product usage data is a category of information captured on users and their behavior and interactions with products.
Product usage data is a category of information captured on users and their behavior and interactions with products.
Product usage data is a category of information captured on users and their behavior and interactions with products.
What is product usage data?
Product usage data is a category of information captured on users and their behavior and interactions with products.
Product usage data can also be aggregated at a team, account or enterprise level to show trends on how customers are using your product.
Why is product usage data important?
Every company is becoming a technology company. Exponentially more customer interactions happen within the bounds of a user interface like an app or website rather than a physical or offline channel.
To succeed in this digital first world, a deeper understanding of your users, their behavior, and needs is not just a nice to have, but an existential requirement.
Product usage data becomes critical in this journey. With it, companies can let data be the arbiter in critical decision making such as:
Feature prioritization
Product roadmaps
Optimizing the user funnel
Increasing conversions
Reducing churn
A/B testing variations of product design and messaging
The better you understand your customers, the more likely you are to hold their attention.
How is product usage data tracked?
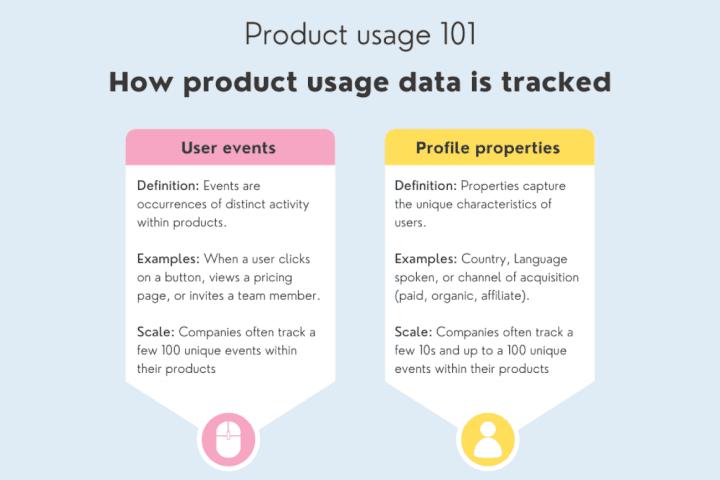
At a high level, product usage data is tracked in a fairly standardized format across top product analytics providers like Amplitude, Mixpanel, Segment, and Heap. It consists of two primary components:
User events: Events are occurrences of distinct activity within products. For example, when a user clicks on a button, views a pricing page, or invites a team member. Companies often track a few 100 unique events that can be performed within their products.
Profile properties: Properties capture the unique characteristics of users. For example, which country or city they are from, what language they speak or what was the channel through which you acquired them (paid marketing, organic, affiliate). Companies often track a few 10s and up to 100 unique properties about each user.
How the best companies use product usage data
The short answer - in every aspect of building and selling products. But let's not let opinions get in the way of real life examples:
Defining product roadmaps: Square uses Amplitude as a central source of truth for prioritizing resources and experiments. Square's product managers can understand users’ behavior and pain points at scale thereby using them as a means to prioritize products and features.

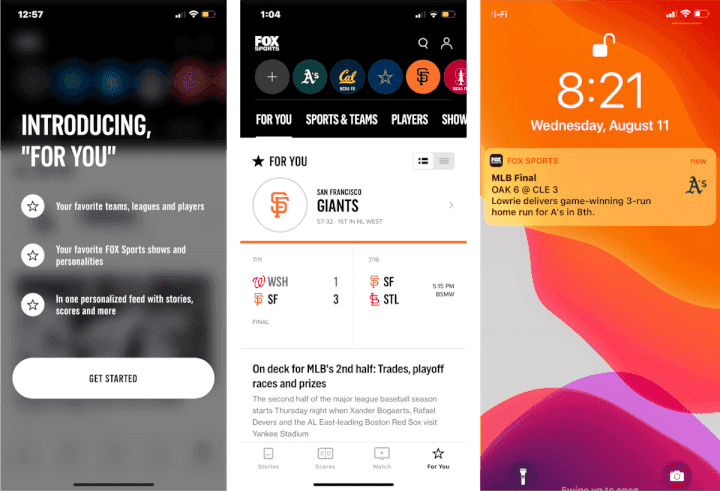
Expanding user base: FOX Sports used Segment to drive a 376% increase in mobile app visitors to the app's “For You” section. FOX analyzed data flowing through Segment in real-time through ML modeling, allowing the company to personalize content and provide a more engaging (up-to-date statistics) and relevant content (latest sports news) to users in highly consumable formats.
Increasing conversion rates: Docusign used Mixpanel to lift conversion rates by 5%. This was experimenting with and exposing certain combinations of gated premium features, to incentivize more free users to upgrade using Mixpanel's funnels feature.

Expanding paid team sizes: Canva combines product usage data with Toplyne to predict which paid teams are most likely to expand to larger sizes. This enables the company's growth team to focus on helping its most engaged teams in gaining more value from the platform and thereby increasing expansion revenue (ARR).
What is product usage data?
Product usage data is a category of information captured on users and their behavior and interactions with products.
Product usage data can also be aggregated at a team, account or enterprise level to show trends on how customers are using your product.
Why is product usage data important?
Every company is becoming a technology company. Exponentially more customer interactions happen within the bounds of a user interface like an app or website rather than a physical or offline channel.
To succeed in this digital first world, a deeper understanding of your users, their behavior, and needs is not just a nice to have, but an existential requirement.
Product usage data becomes critical in this journey. With it, companies can let data be the arbiter in critical decision making such as:
Feature prioritization
Product roadmaps
Optimizing the user funnel
Increasing conversions
Reducing churn
A/B testing variations of product design and messaging
The better you understand your customers, the more likely you are to hold their attention.
How is product usage data tracked?
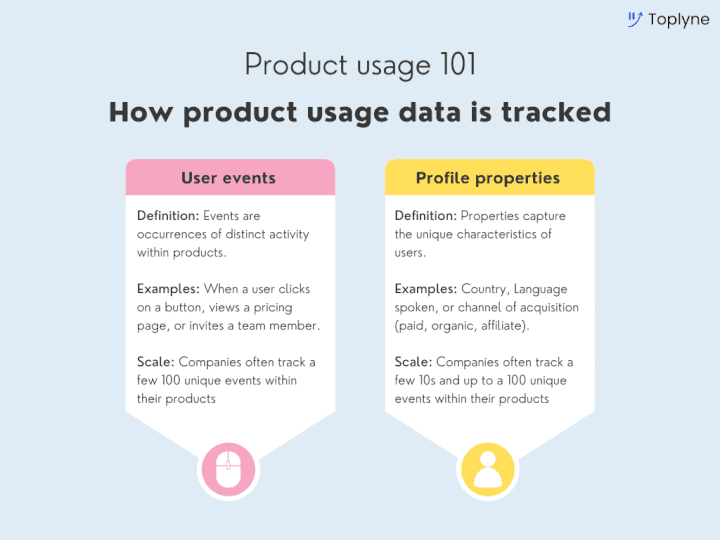
At a high level, product usage data is tracked in a fairly standardized format across top product analytics providers like Amplitude, Mixpanel, Segment, and Heap. It consists of two primary components:
User events: Events are occurrences of distinct activity within products. For example, when a user clicks on a button, views a pricing page, or invites a team member. Companies often track a few 100 unique events that can be performed within their products.
Profile properties: Properties capture the unique characteristics of users. For example, which country or city they are from, what language they speak or what was the channel through which you acquired them (paid marketing, organic, affiliate). Companies often track a few 10s and up to 100 unique properties about each user.
How the best companies use product usage data
The short answer - in every aspect of building and selling products. But let's not let opinions get in the way of real life examples:
Defining product roadmaps: Square uses Amplitude as a central source of truth for prioritizing resources and experiments. Square's product managers can understand users’ behavior and pain points at scale thereby using them as a means to prioritize products and features.
Expanding user base: FOX Sports used Segment to drive a 376% increase in mobile app visitors to the app's “For You” section. FOX analyzed data flowing through Segment in real-time through ML modeling, allowing the company to personalize content and provide a more engaging (up-to-date statistics) and relevant content (latest sports news) to users in highly consumable formats.
Increasing conversion rates: Docusign used Mixpanel to lift conversion rates by 5%. This was experimenting with and exposing certain combinations of gated premium features, to incentivize more free users to upgrade using Mixpanel's funnels feature.
Expanding paid team sizes: Canva combines product usage data with Toplyne to predict which paid teams are most likely to expand to larger sizes. This enables the company's growth team to focus on helping its most engaged teams in gaining more value from the platform and thereby increasing expansion revenue (ARR).
Related Articles

Behavioral Retargeting: A Game-Changer in the Cookieless Era
Unlock the power of behavioral retargeting for the cookieless future! Learn how it personalizes ads & boosts conversions. #behavioralretargeting
All of Toplyne's 40+ Badges in the G2 Spring Reports
Our customers awarded us 40+ badges in G2's Summer Report 2024.

Unlocking the Full Potential of Google PMax Campaigns: Mastering Audience Selection to Double Your ROAS
Copyright © Toplyne Labs PTE Ltd. 2024
Copyright © Toplyne Labs PTE Ltd. 2024
Copyright © Toplyne Labs PTE Ltd. 2024
Copyright © Toplyne Labs PTE Ltd. 2024