Top 10 Sales KPIs for Growth
Top 10 Sales KPIs for Growth
Top 10 Sales KPIs for Growth
Discover the top 10 KPIs you should track to gauge your team's success, along with some handy conversion tips.
Discover the top 10 KPIs you should track to gauge your team's success, along with some handy conversion tips.
Discover the top 10 KPIs you should track to gauge your team's success, along with some handy conversion tips.

“What gets measured, gets managed.”
That’s the cardinal rule for your SaaS sales team!
The right sales KPI (Key Performance Indicator) can shed light on your team’s progress toward their sales goals 🔦, helping them nail their momentous sales targets year after year. 💪
But here’s the tricky part:
You have innumerable sales metrics to choose from.🤯
There’s ⭐Sales Growth⭐ — the king of all sales KPIs.
But you also have sales metrics like Customer Lifetime Value and Sales Cycle Length worth looking at.
![[optimize output image]](https://framerusercontent.com/images/e2nwA6evql3YQv18UUgyaOrvEJY.gif)
You sure do!
So which sales growth KPIs should your sales managers and teams be tracking?
Buckle up, because we’ll answer this and more!
In this article, you’ll discover what sales KPIs are and we’ll highlight 10 key sales KPIs for growth. We’ll also give you quick tips to help you achieve your KPIs.
Psst...You can also take home a winning conversion tool at the end of this article to hit those sales goals like a pro. ⚽
All set?
Let’s go!
What are Sales KPIs?
Sales KPIs are metrics that help you measure the efficacy of your sales efforts. Sales peeps use these sales growth metrics to track progress toward team goals and overall company objectives.
For example, sales managers can use sales metrics to determine their top or worst-performing product offerings, months, sales reps, and more.
Yep, that’s right. Underperforming reps can no longer hide behind their screens!

But that’s not all!
Sales leaders could also use a key performance indicator to track emerging sales trends and themes to optimize their sales cycle and sales funnel.
So let’s get to the essential sales KPIs for growth that should be on your radar.
Ten Essential Sales KPIs to Skyrocket Your SaaS Growth
These are the 10 crucial KPIs your sales manager and sales leaders should be tracking:
1. Sales Opportunities
Sales opportunity is a key performance indicator that measures the estimated value of a lead based on its probability of converting.
Here’s how it works.
First, you categorize your prospects under sales funnel stages like proposal, qualified, and negotiations. You then assign a weighted value (opportunity status) to each stage.
Then, you estimate the value of each lead based on customer demand, the total number of users, company size, etc.
Now bring the two together! 🤝
Here’s the formula:

Let’s say you assign a value of 0.5 to the negotiation stage, and the deal is estimated to make a total of $5,000. Your sales opportunity will be: $5,000 x 0.5 = $2,500
How does this sales KPI help?
Your sales reps can forecast sales estimates from each prospect and focus their efforts on leads with the maximum potential to convert.

Pro tip: You can automatically identify your most promising sales opportunities with a tool like Toplyne. 😉
2. Average Sales Cycle Length
Managers need to know the average time that sales reps take from the initial interaction with a lead to them making a purchase aka the sales cycle. This highlights how fast your sales pipeline moves and sets a benchmark for the future.
Here’s the formula:

For example, let’s say your sales reps closed a total of 4 sales, which took 10, 10, 5, and 15 days respectively.
The average sales cycle length will be:
(10+10+5+15=40)/4 = 10 days
How does this sales KPI help?
The average sales cycle length acts as a benchmark, indicating the desired sales cycle length. Anything longer than this might mean that something needs to change in the sales process.
After all, you want the money to come, but also come in fast, right?
Using this metric, your sales manager can also identify top-performing sales reps and reward them accordingly.
Result: Crown your best performers….

3. Quote-to-Close Rate
As a part of the sales process, a SaaS sales rep will send out hundreds of quotes every month.
But how do managers assess if these efforts are paying off?
Enter: Quote-to-close rate!
This rate tracks the number of deals closed compared to the total number of quotes sent.
Here’s the formula:

If a sales rep sends out 200 quotes in a month and gets 60 subscriptions, their quote-to-close rate is: (60/200) x 100 = 30%.
How does this sales KPI help?
Sales managers can compare current quote-to-close rates with historical trends to evaluate individual performance.
Pro tip: Sales teams can improve this ratio with Toplyne. The tool can help you implement various marketing strategies to bring in better qualified leads for revenue growth.
4. Customer Acquisition Cost
Customer acquisition cost (CAC) is how much it costs you to acquire each new customer during the whole sales process.
This cost depends on your business model (B2B sales or B2C sales), marketing expenses, salaries, and overheads.
Bottom line?
Customer acquisition costs could vary from business to business.
![[optimize output image]](https://framerusercontent.com/images/fxzjCMh7P2BfVNu5iVxddLWX70.gif)
Here’s the formula:

Say you spent $20,000 last month on customer acquisition (including marketing, sales, salaries, and overheads) to onboard 1000 new customers.
Your Customer Acquisition Cost = $20,000/1000 = $20
How does this sales KPI help?
CAC tells you whether your growth is sustainable. If your acquisition cost is greater than the sales revenue you earn from each customer, you won’t make a profit.
You can reduce CAC by investing in owned media (your own blogs, infographics, case studies) and by automating certain sales and marketing activities.
Note: CAC for B2B sales tends to be higher than B2C sales. This is down to the higher ticket size of most B2B leads.
5. Customer Retention and Churn Rate
Customer retention and churn rate have a yin and yang relationship ️.
When one rises, the other one falls.
Customer retention rate is the number of customers who renew their SaaS subscriptions 😀, while churn rate represents the percentage who don’t. 😟
Here’s the formula:
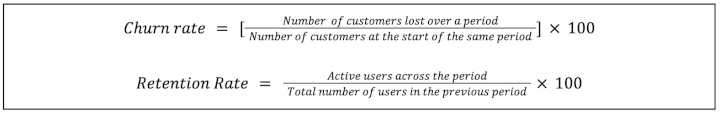
Let’s say you onboarded a total of 100 new customers last month but 5 of them didn’t renew their subscriptions at the end of the month.
So, your churn rate will be (5/100) x 100 = 5%
Accordingly, your customer retention rate would be = [(100-5)/100)] x100 = 95%
PS: The average monthly churn rate for SaaS companies is 3-8%, so the average retention rate should be 92-97%.
How does this sales KPI help?
A rising retention rate means that your customer loyalty is increasing. Yay!!!
You’ll also likely receive a higher Net Promoter Score (NPS.)
On the other hand, a rising churn rate could indicate issues like:
Poor customer satisfaction
Poor customer service
Stiff competition
Pro tip: It’s more cost-effective to retain an existing customer than to bring in a new customer. So pay close attention to these key sales performance indicators!
6. Average Revenue Per User
Average Revenue Per User (ARPU) is the money you earn from each subscriber over a specific period.
Here’s the formula:

How does this sales KPI help?
It’s important to have higher average sales revenue per user for the better financial health of your business.
Let’s say you earn $10,000 from 100 premium subscribers ($100 each). On the other hand, you earn $5000 from 1000 basic-plan subscribers ($5 each.)
Your ARPU = $15000/1100 = $13.64
Now, if 50 of your basic subscribers opt for the premium plan, your sales revenue will be:
Premium subscribers: 10,000 + (100*50)= $15000
Remaining basic plan subscribers: (1000-50)*5 = $4750
Total new sales revenue = $19750
Your new ARPU is 19750/1100= $17.96
Now, even though your subscribers remain the same, the average revenue per user is higher due to users opting for the premium plan.
Bottom line?
A higher ARPU indicates that your marketing and sales teams can leverage the current sales strategy and get users to invest more in the product.
7. Monthly Recurring Revenue
Monthly Recurring Revenue (MRR) is the revenue you can expect to earn every month based on all active subscriptions.
Here’s the formula:

If your ARPU = $100 and the total number of monthly subscribers is 20,
Your MRR = 100x20= $2000
How does this sales KPI help?
MRR gives you an understanding of how much money you bring in every month, which you can then distribute among your teams to improve your product!
A growing MRR also indicates high customer satisfaction.
It’s simple: If they’re happy with you, they’ll keep giving you their money. 🤑
8. Customer Lifetime Value
Customer Lifetime Value (CLV) is a sales metric that tracks how much you’ll earn from an existing customer throughout the business relationship.
You also need to factor in the money you spent on sales and marketing efforts to bring them on board, i.e. the Customer Acquisition Cost.
Here’s the formula:

Let’s say the customer revenue per year is $1000, the user buys a subscription for 2 years and the cost of acquiring the customer is $20.
Your Customer Lifetime Value = (1000x2) - 20 = $1980
How does this sales KPI help?
Your sales managers and sales leaders can use this metric to make future business decisions, like targeting users with a higher projected CLV. Your customer support teams should also aim to improve CLV by offering better customer service and user experience.
9. Sales Per Rep
Sales per rep is the number of sales generated by each sales representative.
A sales leader usually compares this figure to previous periods to assess employee productivity.
Here’s the formula:

Let’s say your sales for a month was $10,000 and a sales rep closed 5 deals.
So the sale per rep = 10,000/5 = $2000
How does this sales KPI help?
Sales managers can use this KPI to set a sales target for each rep. They could also create a leaderboard showing these stats, boosting transparency and accountability within the team.
Having a leaderboard and clear targets can also foster healthy competition within the team and even motivate your reps to work harder!
10. Revenue or Sales Growth
All the above KPIs are the pieces 🧩 that eventually fit into the big jigsaw puzzle — Revenue Growth.
Revenue growth is a sales growth metric that measures how your sales volume is increasing or decreasing over time, represented as a percentage.
Here’s the formula:

For example, your company achieves $100,000 in sales in the current year, and the previous year’s sale value was $75,000.
Sales growth = ((100,000-75,000)/75,000) x 100 = 33.3%
Generally, SaaS companies calculate sales growth annually, but you can track monthly sales growth too. Monthly sales growth is especially useful for new SaaS players or for companies whose sales process is affected by seasonal trends.
How does this sales KPI help?
This KPI can help you predict future sales, identify trends, and showcase your company’s growth.
But that’s not all!
By setting a sales growth target, you can create a cascade of interdependent KPIs for your entire sales team, all of which should work together to achieve those big company goals.
Now you know which sales growth KPIs to track. Fantastic!
But how do you hit your KPI goals out of the park?
How To Effectively Meet Your Sales KPIs for Growth
Here are three critical steps to nail those sales metrics like a pro:
1. Tie Your Sales KPIs to Company Objectives
While specific sales metrics are relevant for specific teams, sales KPIs are common goals shared by multiple departments.
So?
When you sit with your cross-functional team to discuss your sales goal, ensure that it aligns with your company’s overarching goals.

2. Categorize Your KPIs
Next, divide your sales KPIs into two categories:
Leading Indicators that predict the future or what you’re likely to achieve — for example, percentage growth in new sales.
Lagging Indicators that measure what you’ve already achieved — for example, annual sales.
Note: Balancing the two categories is crucial, as your lagging indicators serve as benchmarks for your leading indicators.
3. Use Toplyne to Identify the Right Campaigns to Boost Conversions
Alright.
You’ve identified the right KPIs for your sales team and your sales reps are geared up to keep the money flowing.
But you still need a smart way to identify the right leads to hit those sales volume targets faster.
Say hello to Toplyne 👋🏻
Toplyne is a behavioral lead scoring tool that enables SaaS companies to identify and focus on the users and accounts that are most likely to convert based on in-product actions.
If your inner voice says…

Here’s how companies like Pitch and Vercel generate sales pipeline from their self-serve funnel using Toplyne:
Step 1/7: Create monetization playbooks to surface conversion and expansion opportunities (leads most likely to convert to paying customers, and teams most likely to grow into larger teams)

Step 2/7: Choose the right leads to target – users (individual users) or accounts (a group of users with an organization).

Step 3/7: Select the frequency at which you would want leads synced in your GTM apps.

Step 4/7: Define how many leads you want by either the number of leads or your expected win rate, depending on your sales capacity and GTM strategy.

Step 5/7: Build custom segments - Build custom segments based on And/Or logic at the deepest level of sub-properties within your product analytics.

Step 6/7: Validate your GTM strategy - Hold back some users as a control group to test your GTM strategy.

Step 7/7: Sync your product qualified pipeline into your GTM destinations - CRMs, sales & marketing execution tools, and customer engagement platforms.

Discover how product-led sales can help your sales team identify well-qualified prospects quickly.
Nail Those Sales KPIs with Toplyne! 🎯
To boost sales growth, you need to track the right sales KPIs.
The 10 sales performance indicators we listed are some of the most crucial metrics you need to keep your eyes on.👀
While tracking these KPIs is one thing, boosting them is another game altogether — one you can’t win without knowing which leads to focus on.
And that’s where a conversion tool like Toplyne can help you.
Use it to identify the most promising leads for your business and deploy the right marketing strategies at different stages of your sales funnel for faster conversions.
Sign up for Toplyne for free today to take your sales game to the next level!

“What gets measured, gets managed.”
That’s the cardinal rule for your SaaS sales team!
The right sales KPI (Key Performance Indicator) can shed light on your team’s progress toward their sales goals 🔦, helping them nail their momentous sales targets year after year. 💪
But here’s the tricky part:
You have innumerable sales metrics to choose from.🤯
There’s ⭐Sales Growth⭐ — the king of all sales KPIs.
But you also have sales metrics like Customer Lifetime Value and Sales Cycle Length worth looking at.
You sure do!
So which sales growth KPIs should your sales managers and teams be tracking?
Buckle up, because we’ll answer this and more!
In this article, you’ll discover what sales KPIs are and we’ll highlight 10 key sales KPIs for growth. We’ll also give you quick tips to help you achieve your KPIs.
Psst...You can also take home a winning conversion tool at the end of this article to hit those sales goals like a pro. ⚽
All set?
Let’s go!
What are Sales KPIs?
Sales KPIs are metrics that help you measure the efficacy of your sales efforts. Sales peeps use these sales growth metrics to track progress toward team goals and overall company objectives.
For example, sales managers can use sales metrics to determine their top or worst-performing product offerings, months, sales reps, and more.
Yep, that’s right. Underperforming reps can no longer hide behind their screens!
But that’s not all!
Sales leaders could also use a key performance indicator to track emerging sales trends and themes to optimize their sales cycle and sales funnel.
So let’s get to the essential sales KPIs for growth that should be on your radar.
Ten Essential Sales KPIs to Skyrocket Your SaaS Growth
These are the 10 crucial KPIs your sales manager and sales leaders should be tracking:
1. Sales Opportunities
Sales opportunity is a key performance indicator that measures the estimated value of a lead based on its probability of converting.
Here’s how it works.
First, you categorize your prospects under sales funnel stages like proposal, qualified, and negotiations. You then assign a weighted value (opportunity status) to each stage.
Then, you estimate the value of each lead based on customer demand, the total number of users, company size, etc.
Now bring the two together! 🤝
Here’s the formula:
Let’s say you assign a value of 0.5 to the negotiation stage, and the deal is estimated to make a total of $5,000. Your sales opportunity will be: $5,000 x 0.5 = $2,500
How does this sales KPI help?
Your sales reps can forecast sales estimates from each prospect and focus their efforts on leads with the maximum potential to convert.
Pro tip: You can automatically identify your most promising sales opportunities with a tool like Toplyne. 😉
2. Average Sales Cycle Length
Managers need to know the average time that sales reps take from the initial interaction with a lead to them making a purchase aka the sales cycle. This highlights how fast your sales pipeline moves and sets a benchmark for the future.
Here’s the formula:
For example, let’s say your sales reps closed a total of 4 sales, which took 10, 10, 5, and 15 days respectively.
The average sales cycle length will be:
(10+10+5+15=40)/4 = 10 days
How does this sales KPI help?
The average sales cycle length acts as a benchmark, indicating the desired sales cycle length. Anything longer than this might mean that something needs to change in the sales process.
After all, you want the money to come, but also come in fast, right?
Using this metric, your sales manager can also identify top-performing sales reps and reward them accordingly.
Result: Crown your best performers….
3. Quote-to-Close Rate
As a part of the sales process, a SaaS sales rep will send out hundreds of quotes every month.
But how do managers assess if these efforts are paying off?
Enter: Quote-to-close rate!
This rate tracks the number of deals closed compared to the total number of quotes sent.
Here’s the formula:
If a sales rep sends out 200 quotes in a month and gets 60 subscriptions, their quote-to-close rate is: (60/200) x 100 = 30%.
How does this sales KPI help?
Sales managers can compare current quote-to-close rates with historical trends to evaluate individual performance.
Pro tip: Sales teams can improve this ratio with Toplyne. The tool can help you implement various marketing strategies to bring in better qualified leads for revenue growth.
4. Customer Acquisition Cost
Customer acquisition cost (CAC) is how much it costs you to acquire each new customer during the whole sales process.
This cost depends on your business model (B2B sales or B2C sales), marketing expenses, salaries, and overheads.
Bottom line?
Customer acquisition costs could vary from business to business.
Here’s the formula:
Say you spent $20,000 last month on customer acquisition (including marketing, sales, salaries, and overheads) to onboard 1000 new customers.
Your Customer Acquisition Cost = $20,000/1000 = $20
How does this sales KPI help?
CAC tells you whether your growth is sustainable. If your acquisition cost is greater than the sales revenue you earn from each customer, you won’t make a profit.
You can reduce CAC by investing in owned media (your own blogs, infographics, case studies) and by automating certain sales and marketing activities.
Note: CAC for B2B sales tends to be higher than B2C sales. This is down to the higher ticket size of most B2B leads.
5. Customer Retention and Churn Rate
Customer retention and churn rate have a yin and yang relationship ️.
When one rises, the other one falls.
Customer retention rate is the number of customers who renew their SaaS subscriptions 😀, while churn rate represents the percentage who don’t. 😟
Here’s the formula:
Let’s say you onboarded a total of 100 new customers last month but 5 of them didn’t renew their subscriptions at the end of the month.
So, your churn rate will be (5/100) x 100 = 5%
Accordingly, your customer retention rate would be = [(100-5)/100)] x100 = 95%
PS: The average monthly churn rate for SaaS companies is 3-8%, so the average retention rate should be 92-97%.
How does this sales KPI help?
A rising retention rate means that your customer loyalty is increasing. Yay!!!
You’ll also likely receive a higher Net Promoter Score (NPS.)
On the other hand, a rising churn rate could indicate issues like:
Poor customer satisfaction
Poor customer service
Stiff competition
Pro tip: It’s more cost-effective to retain an existing customer than to bring in a new customer. So pay close attention to these key sales performance indicators!
6. Average Revenue Per User
Average Revenue Per User (ARPU) is the money you earn from each subscriber over a specific period.
Here’s the formula:
How does this sales KPI help?
It’s important to have higher average sales revenue per user for the better financial health of your business.
Let’s say you earn $10,000 from 100 premium subscribers ($100 each). On the other hand, you earn $5000 from 1000 basic-plan subscribers ($5 each.)
Your ARPU = $15000/1100 = $13.64
Now, if 50 of your basic subscribers opt for the premium plan, your sales revenue will be:
Premium subscribers: 10,000 + (100*50)= $15000
Remaining basic plan subscribers: (1000-50)*5 = $4750
Total new sales revenue = $19750
Your new ARPU is 19750/1100= $17.96
Now, even though your subscribers remain the same, the average revenue per user is higher due to users opting for the premium plan.
Bottom line?
A higher ARPU indicates that your marketing and sales teams can leverage the current sales strategy and get users to invest more in the product.
7. Monthly Recurring Revenue
Monthly Recurring Revenue (MRR) is the revenue you can expect to earn every month based on all active subscriptions.
Here’s the formula:
If your ARPU = $100 and the total number of monthly subscribers is 20,
Your MRR = 100x20= $2000
How does this sales KPI help?
MRR gives you an understanding of how much money you bring in every month, which you can then distribute among your teams to improve your product!
A growing MRR also indicates high customer satisfaction.
It’s simple: If they’re happy with you, they’ll keep giving you their money. 🤑
8. Customer Lifetime Value
Customer Lifetime Value (CLV) is a sales metric that tracks how much you’ll earn from an existing customer throughout the business relationship.
You also need to factor in the money you spent on sales and marketing efforts to bring them on board, i.e. the Customer Acquisition Cost.
Here’s the formula:
Let’s say the customer revenue per year is $1000, the user buys a subscription for 2 years and the cost of acquiring the customer is $20.
Your Customer Lifetime Value = (1000x2) - 20 = $1980
How does this sales KPI help?
Your sales managers and sales leaders can use this metric to make future business decisions, like targeting users with a higher projected CLV. Your customer support teams should also aim to improve CLV by offering better customer service and user experience.
9. Sales Per Rep
Sales per rep is the number of sales generated by each sales representative.
A sales leader usually compares this figure to previous periods to assess employee productivity.
Here’s the formula:
Let’s say your sales for a month was $10,000 and a sales rep closed 5 deals.
So the sale per rep = 10,000/5 = $2000
How does this sales KPI help?
Sales managers can use this KPI to set a sales target for each rep. They could also create a leaderboard showing these stats, boosting transparency and accountability within the team.
Having a leaderboard and clear targets can also foster healthy competition within the team and even motivate your reps to work harder!
10. Revenue or Sales Growth
All the above KPIs are the pieces 🧩 that eventually fit into the big jigsaw puzzle — Revenue Growth.
Revenue growth is a sales growth metric that measures how your sales volume is increasing or decreasing over time, represented as a percentage.
Here’s the formula:
For example, your company achieves $100,000 in sales in the current year, and the previous year’s sale value was $75,000.
Sales growth = ((100,000-75,000)/75,000) x 100 = 33.3%
Generally, SaaS companies calculate sales growth annually, but you can track monthly sales growth too. Monthly sales growth is especially useful for new SaaS players or for companies whose sales process is affected by seasonal trends.
How does this sales KPI help?
This KPI can help you predict future sales, identify trends, and showcase your company’s growth.
But that’s not all!
By setting a sales growth target, you can create a cascade of interdependent KPIs for your entire sales team, all of which should work together to achieve those big company goals.
Now you know which sales growth KPIs to track. Fantastic!
But how do you hit your KPI goals out of the park?
How To Effectively Meet Your Sales KPIs for Growth
Here are three critical steps to nail those sales metrics like a pro:
1. Tie Your Sales KPIs to Company Objectives
While specific sales metrics are relevant for specific teams, sales KPIs are common goals shared by multiple departments.
So?
When you sit with your cross-functional team to discuss your sales goal, ensure that it aligns with your company’s overarching goals.
2. Categorize Your KPIs
Next, divide your sales KPIs into two categories:
Leading Indicators that predict the future or what you’re likely to achieve — for example, percentage growth in new sales.
Lagging Indicators that measure what you’ve already achieved — for example, annual sales.
Note: Balancing the two categories is crucial, as your lagging indicators serve as benchmarks for your leading indicators.
3. Use Toplyne to Identify the Right Campaigns to Boost Conversions
Alright.
You’ve identified the right KPIs for your sales team and your sales reps are geared up to keep the money flowing.
But you still need a smart way to identify the right leads to hit those sales volume targets faster.
Say hello to Toplyne 👋🏻
Toplyne is a behavioral lead scoring tool that enables SaaS companies to identify and focus on the users and accounts that are most likely to convert based on in-product actions.
If your inner voice says…
Here’s how companies like Pitch and Vercel generate sales pipeline from their self-serve funnel using Toplyne:
Step 1/7: Create monetization playbooks to surface conversion and expansion opportunities (leads most likely to convert to paying customers, and teams most likely to grow into larger teams)
Step 2/7: Choose the right leads to target – users (individual users) or accounts (a group of users with an organization).
Step 3/7: Select the frequency at which you would want leads synced in your GTM apps.
Step 4/7: Define how many leads you want by either the number of leads or your expected win rate, depending on your sales capacity and GTM strategy.
Step 5/7: Build custom segments - Build custom segments based on And/Or logic at the deepest level of sub-properties within your product analytics.
Step 6/7: Validate your GTM strategy - Hold back some users as a control group to test your GTM strategy.
Step 7/7: Sync your product qualified pipeline into your GTM destinations - CRMs, sales & marketing execution tools, and customer engagement platforms.
Discover how product-led sales can help your sales team identify well-qualified prospects quickly.
Nail Those Sales KPIs with Toplyne! 🎯
To boost sales growth, you need to track the right sales KPIs.
The 10 sales performance indicators we listed are some of the most crucial metrics you need to keep your eyes on.👀
While tracking these KPIs is one thing, boosting them is another game altogether — one you can’t win without knowing which leads to focus on.
And that’s where a conversion tool like Toplyne can help you.
Use it to identify the most promising leads for your business and deploy the right marketing strategies at different stages of your sales funnel for faster conversions.
Sign up for Toplyne for free today to take your sales game to the next level!
Related Articles

Behavioral Retargeting: A Game-Changer in the Cookieless Era
Unlock the power of behavioral retargeting for the cookieless future! Learn how it personalizes ads & boosts conversions. #behavioralretargeting
All of Toplyne's 40+ Badges in the G2 Spring Reports
Our customers awarded us 40+ badges in G2's Summer Report 2024.

Unlocking the Full Potential of Google PMax Campaigns: Mastering Audience Selection to Double Your ROAS
Copyright © Toplyne Labs PTE Ltd. 2024
Copyright © Toplyne Labs PTE Ltd. 2024
Copyright © Toplyne Labs PTE Ltd. 2024
Copyright © Toplyne Labs PTE Ltd. 2024